ExpLab
A/B Testing & Experimentation Platform · Statistical Engine · Full-Stack
Project Info
- Domain: Applied Data Science / Analytics Engineering
- Stack: Python, FastAPI, React 18, SciPy, statsmodels, PostgreSQL, Docker
- GitHub: View Repository
The Problem
Most teams run A/B tests without proper power analysis, leading to underpowered experiments and false positives. Black-box tools hide the statistics, making results unauditable — and offer no way to monitor experiments safely while data is still collecting.
What I Built
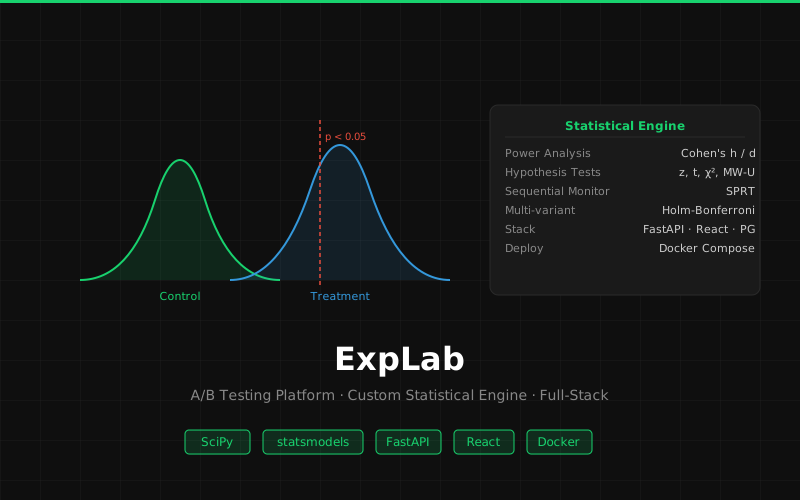
- Built a custom statistical engine from first principles covering pre-experiment power analysis (Cohen's h for proportions, Cohen's d for continuous metrics), hypothesis testing (z-test, t-test, Mann-Whitney U, chi-squared), and sequential monitoring with SPRT — implemented directly from statistical formulas, not wrapped libraries
- Five-page React dashboard: experiment wizard, power curve visualization across MDE values, live results with effect size and confidence intervals, sequential monitoring view, and full experiment history
- FastAPI backend with PostgreSQL persistence and Docker Compose deployment — production-ready architecture with CSV upload support for external data sources
Impact
Gives data science and product teams a transparent, audit-ready experimentation platform where every statistical decision — sample size, test choice, stopping rule — is configurable, visible, and explainable.